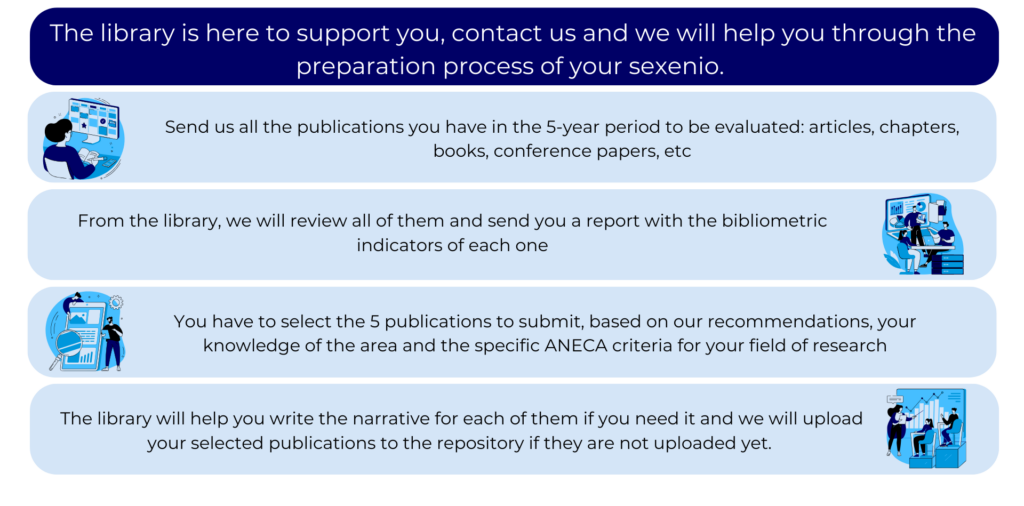

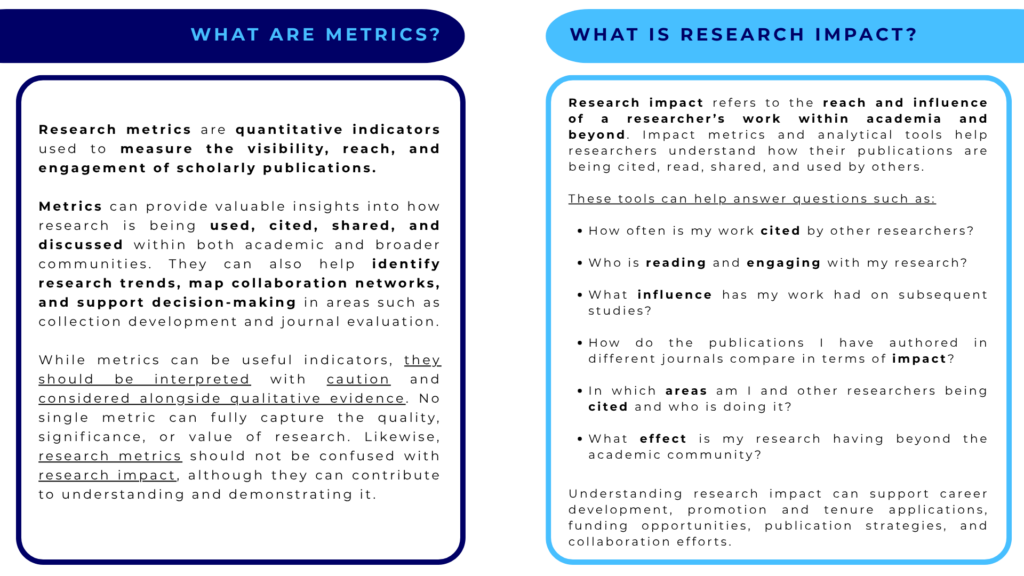
Bibliometric indicators are quantitative metrics that allow the quality and impact of scientific results to be assessed.
To ensure a responsible use, it is essential to contextualize the indicators used, consider their limitations and complement them with other types of evidence. Indicators should be use to justify qualitative judgement on research assessment and no metric or combination of metrics should be used as a substitute for expert peer review in research performance assessment.
All metrics have weaknesses and biases. Not taking biases into account means that any interpretation or analysis will always be incomplete and can lead to lead to unwise decisions.
For more information on the responsible use of metrics and good practice in research evaluation, please visit the following websites:
Author-level metrics assess the overall influence and visibility of an individual researcher's scholarly output. Rather than focusing on the impact of a single publication, these indicators provide a broader view of a researcher's contributions over time.
Author-level metrics are derived from publication-level data, such as citations and usage statistics, and combine this information to assess the cumulative reach and influence of a researcher's body of work. They can help researchers monitor their academic performance, demonstrate research impact, and support applications for funding, promotion, and recognition.
The h-index is one of the most widely used author-level metrics. It combines information about a researcher's publication output and the citations those publications have received.
A researcher has an h-index of h when they have published h papers that have each received at least h citations. For example, an h-index of 10 means that a researcher has 10 publications that have each been cited at least 10 times.
Because bibliographic databases differ in their coverage and indexing criteria, a researcher's h-index may vary between platforms such as Scopus, Web of Science, and Google Scholar.
While the h-index can provide a useful indication of a researcher's scholarly influence, it should not be used as the sole measure of research performance. Some important limitations include:
In line with the principles of responsible research assessment, the h-index should therefore be considered alongside qualitative evidence, disciplinary context, and expert judgement when evaluating research performance.
Several platforms can be used to calculate a researcher's h-index. Results may vary because each database has different coverage and indexing criteria:
Scopus and Web of Science provide researcher profiles with a range of author-level metrics. These profiles allow researchers to monitor their scholarly impact and review information about their publications, citations, and other indicators.
You can learn more about the researcher metrics available on each platform:
Citation tracking allows researchers to identify who is citing their work and understand how their research is influencing subsequent studies. It can also help uncover emerging trends, follow the development of ideas within a field, and discover related research.
Just as a bibliography reveals the sources that informed a publication, citation tracking shows how that publication has been used and referenced by later works. Common tools for tracking citations include Web of Science, Scopus, and Google Scholar.
Citations are one of the most widely used article-level metrics, providing an indication of a publication's scholarly reach and influence.
Normalized citations assess the citation impact of publications by comparing the number of citations they receive with the number expected for publications of similar age, subject area, and other relevant characteristics.
A normalized citation value above 1.0 generally indicates that a publication has received more citations than expected for comparable publications, while a value below 1.0 indicates below-average citation impact.
Different databases provide different types of normalized citation indicators:
Web of Science
In Web of Science, citation counts can be collected in two main ways:
Google Scholar
Google Scholar displays citation counts for individual publications. Click the Cited by link to view the sources citing a particular article.
Researchers can also create a Google Scholar Author Profile and set up email alerts to keep track of new citations to their work.
Dimensions is a research analytics platform that provides citation metrics alongside contextual information, helping researchers understand how publications perform relative to others in the same field.
Key indicators include:
Dimensions also provides contextual information and summaries to help researchers interpret the citation metrics associated with each publication.
Journal-level metrics are used to assess the impact, visibility, and relevance of a journal, primarily through citation-based indicators. They can be useful for comparing journals within the same field.
However, journal-level metrics should not be used as the sole evidence of research quality. A journal's metrics do not demonstrate the quality of an individual publication, so they should always be considered alongside other indicators and qualitative evidence.
The Journal Impact Factor (JIF) measures the average number of citations received by articles published in a journal. It is calculated using citations received in the current year by citable articles published during the previous two years. Journal self-citations are included in the calculation.
The JIF can be accessed through Journal Citation Reports (JCR): Journal Citation Reports .
Remember: JCR is the platform, while the Journal Impact Factor is the metric reported for individual journals within the platform.
Several platforms provide journal-level metrics and information about journals. Their coverage, indicators, and methodologies may differ.
Journal Citation Reports (JCR) provides journal-level citation indicators and ranks journals within subject categories.
Journals within the same category can be ranked from highest to lowest Journal Impact Factor and divided into four equal groups, known as quartiles. Quartiles indicate a journal's relative position within its subject category.
The Journal Impact Factor Percentile (JIF Percentile) converts a journal's position within its category into a percentile, allowing for easier comparison between journals from different categories.
The JIF Percentile is calculated as:
JIF Percentile = (N – R + 0.5) / N
Where N is the number of journals in the category and R is the journal's descending rank. A higher percentile indicates a higher relative position within the category.
Remember: JCR is the platform, while the Journal Impact Factor is the metric provided for individual journals.
CiteScore is a Scopus metric that measures the average number of citations received by documents published by a journal over a four-year period.
Journals are ranked within their subject categories and can be divided into quartiles and deciles. These rankings indicate a journal's relative position within its field and can provide useful context when comparing journals.
CiteScore also provides a percentile, which expresses a journal's position within its subject category and facilitates comparisons between different categories.
CiteScore can be accessed through Scopus .
More information: CiteScore metrics .
The SCImago Journal & Country Rank (SJR) measures journal visibility based on the average number of weighted citations received by articles published during the previous three years.
Citations are weighted according to the influence of the citing journals, giving greater weight to citations from more influential sources.
Journals are ranked within their subject categories and can be divided into quartiles and deciles. These rankings indicate a journal's relative position within its field.
Matriz de Información para el Análisis de Revistas (MIAR) is an information resource that brings together data from more than 100 sources, including journal directories and international indexing and abstracting databases.
MIAR provides information on where journals are indexed, the platforms where they are evaluated, where their metrics can be found, and their Open Access policies.
It can therefore be used to check a journal's visibility, indexing, and other relevant information.
The FECYT Quality Seal recognizes Spanish scientific journals that meet internationally recognized standards of editorial and professional quality and promote open and inclusive science, science culture, and science education.
The presence of a journal in the FECYT Quality Seal list provides evidence that it has met the evaluation criteria established by FECYT.
You can search for journals using the FECYT Visibility and Impact Classification .
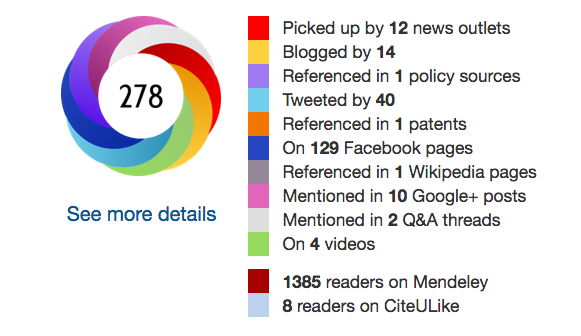
Altmetrics (alternative metrics) complement traditional citation-based indicators by measuring the attention and engagement that research outputs receive beyond academic literature. They track mentions across a variety of sources, including news outlets, blogs, social media, policy documents, and other online platforms.
Altmetrics can help researchers:
Unlike traditional citation metrics, altmetrics do not measure scholarly impact directly. Instead, they provide additional insights into how research is being shared, discussed, and used outside of academic publishing
As with any metric, altmetrics should be interpreted carefully and alongside other indicators. Key limitations include:
For these reasons, altmetrics are best used as a complement to traditional metrics and qualitative evidence when assessing the reach and influence of research.
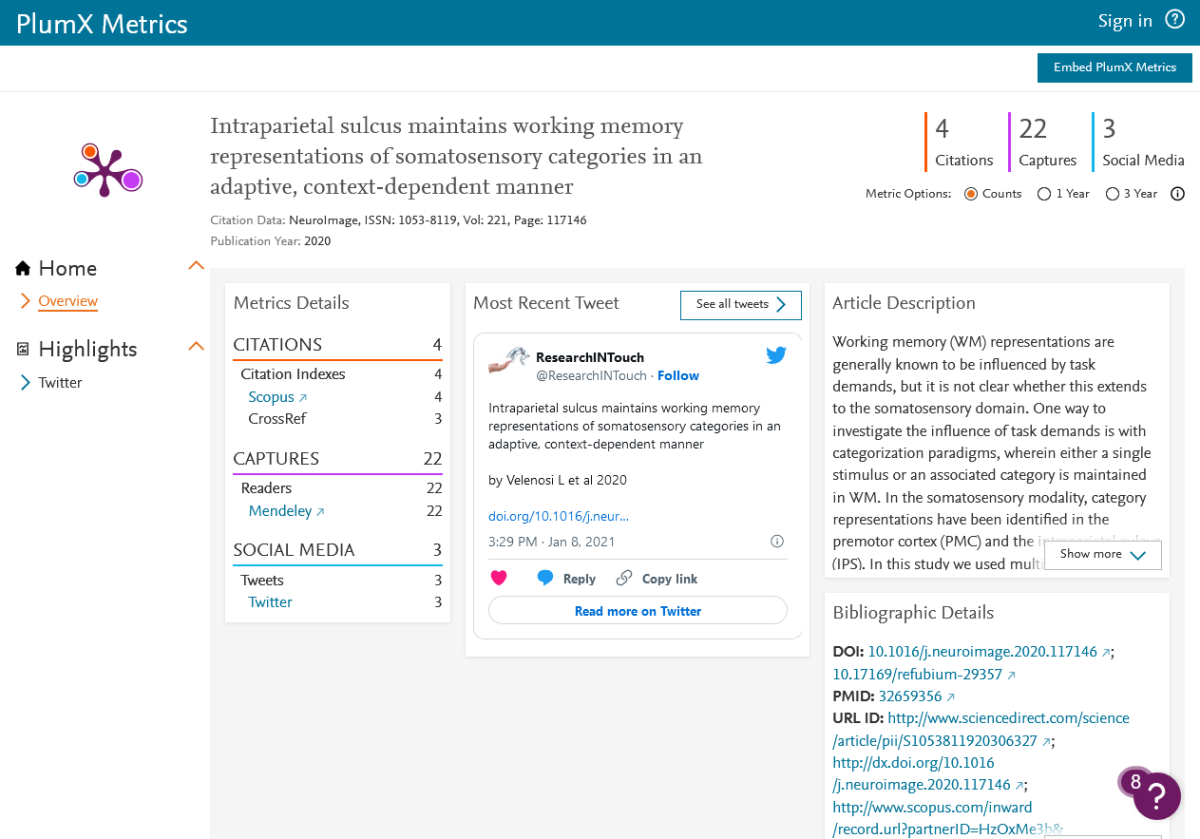
Views measure how often a research output has been accessed online, typically through HTML page views, PDF downloads, or abstract views. These metrics can indicate interest in a publication and are often considered evidence of its potential reach.
High view counts suggest that an article is attracting attention, although they do not reveal how the content is being used or interpreted. Publications with many views but relatively few citations may be reaching audiences beyond academia, such as students, practitioners, policymakers, or the general public.
Citations measure how often a publication is referenced by other works and remain one of the most widely used indicators of scholarly influence.
Some altmetrics platforms also track citations in non-academic sources, such as news articles, policy documents, or Wikipedia, providing additional insights into a publication’s broader impact.
When comparing citation counts across multiple databases, it is important to note that the same citation may be indexed by more than one source. As a result, citation totals from different platforms should not simply be added together
Also known as captures, save metrics indicate how often a publication has been bookmarked or stored for future use in tools such as Mendeley or other reference management platforms.
A saved article may suggest that readers intend to cite, share, teach, or consult it in future work. These metrics can therefore provide an early indication of potential scholarly engagement.
Also known as discussion metrics, mentions track online conversations and attention surrounding a research output.
Examples include:
Because they can appear shortly after publication, mentions often provide one of the earliest signals of attention and engagement.
Through the National Commission for the Evaluation of Research Activity (CNEAI), ANECA carries out the evaluation of the research activity of university researchers with the aim of contributing to the promotion of the quality of the Spanish university system within the framework of the criteria and guidelines for quality assurance in the European Higher Education Area and the design of a teaching and research career model for academic researchers.